

Choose how to get started
In Progreso you can scan your body or choose the option to scan and create a plan.
Take guided photos, review estimates, and go back to history when you want to compare.
It is not necessary to discover everything at once.
Start with these three steps.
In Progreso you can scan your body or choose the option to scan and create a plan.
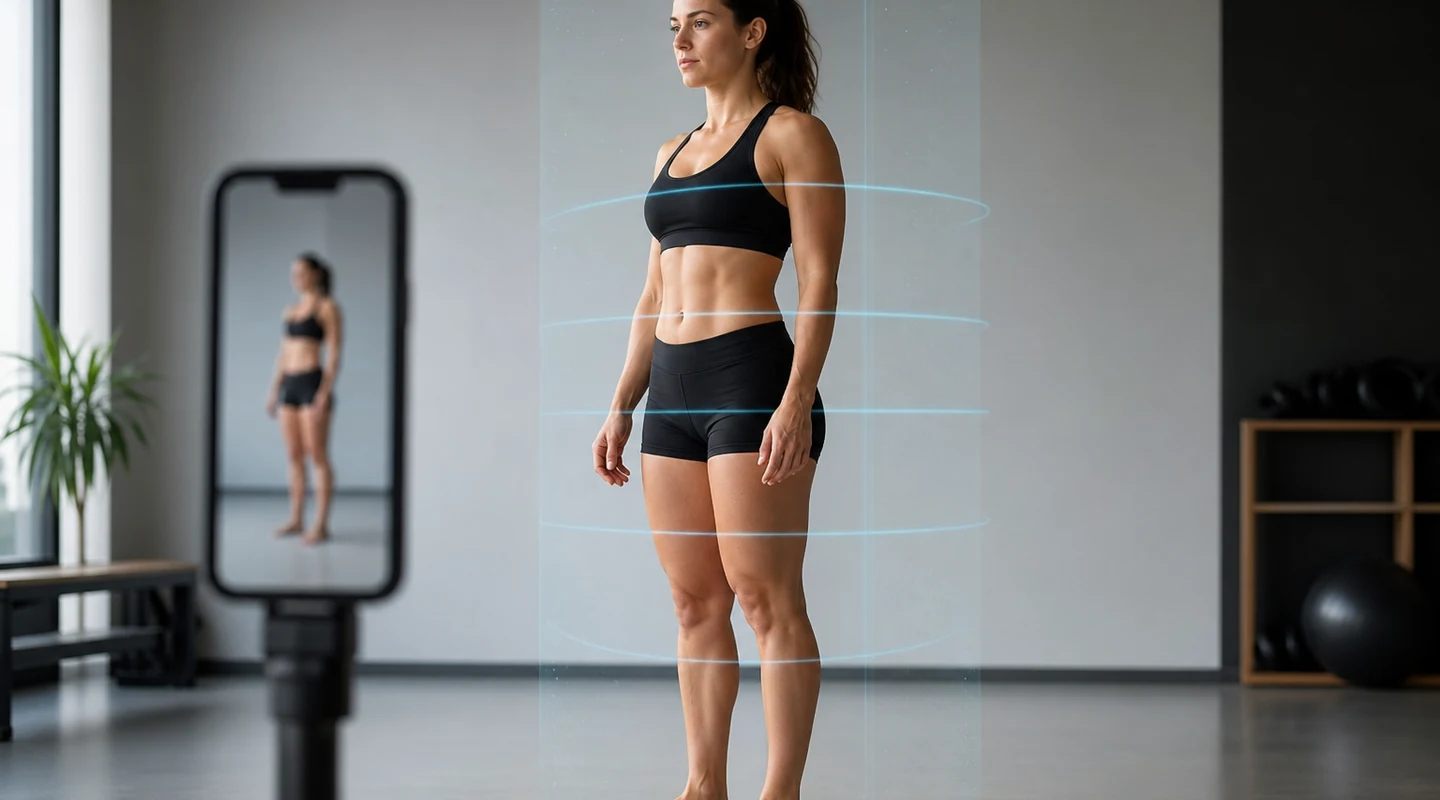
Follow the instructions to prepare the camera and take the four photos: front, side, back and legs.
Review estimated indicators, such as body fat and muscle mass, and go back to history to compare your scans between different dates.
You are starting a new stage of training. Save a starting point and return to history when you want to review your previous scans.
You connect your starting point with a way to follow your evolution over time.
Three studies compared body fat estimates from photos with DXA, an imaging technique used as a reference for measuring body composition.
The 2022 method estimated body fat from two photos, front and back. Bodia adds a side view that shows the torso in profile and a leg photo that captures more detail of the lower body.
The four views complement one another and give the analysis more information about body shape and proportions. The goal is to reduce error when estimating body fat.
The app guides you through all four photos and saves your estimates in your history so you can compare scans over time.
0.98 overall agreement (CCC)
Ferreira and colleagues evaluated Shaped. Overall agreement with DXA was 0.98 and remained at or above 0.96 in the subgroups analyzed. A CCC close to 1 indicates high agreement in the group. It does not express individual accuracy as a percentage.
Read the 2025 study Ferreira et al. · npj Digital Medicine2.16 percentage points of mean absolute error
Majmudar and colleagues tested an algorithm using front and back photos. On average, estimates were 2.16 percentage points away from DXA, with differences above and below DXA counted the same way.
Read the 2022 study Majmudar et al. · npj Digital Medicine2.95 percentage points of RMSE for the best-performing app
Encarnação and colleagues compared MeThreeSixty, Bodygram and ZOZO Fit. ZOZO Fit used 12 photos per scan and had the lowest RMSE, a measure that gives more weight to larger differences. None of the apps demonstrated statistical equivalence to DXA within ±2 percentage points.
Read the 2026 study Encarnação et al. · Clinical Nutrition ESPENIf DXA shows 20% body fat and the two-photo method estimates 22.16%, the difference is 2.16 percentage points.
In the same example, a simulated error of +1.5 points would place Bodia at 21.5%. The difference can also go in the other direction.
In the 2022 study, the limits of agreement with DXA were −5.5 to +4.7 percentage points.
2022 study · two photos
Bodia · four-photo simulation
On the same scale, the four-photo scenario runs from about −4.0 to +3.2 percentage points versus DXA.
We start from the limits in the 2022 study and keep its average difference of about −0.4 points. If every view were equally informative and equally weighted, with independent errors, going from two to four photos would reduce the spread to √(2/4) ≈ 0.71 of the original.
Assuming errors follow a normal distribution, the model gives a mean absolute error of about 1.5 percentage points and the simulated limits shown in the chart.
How to read your scans. When comparing scans, try to keep the lighting, clothing and pose consistent. A small difference between scans may come from variation in the estimate.
No. It is a tracking tool within Bodia; It should not be interpreted as a diagnosis or a clinical measurement.
Choose a plan, open your training
and keep what you did.


Bodia collects and processes personal data to operate the platform, manage accounts, respond to requests, improve the experience, and meet legal and security obligations.
We do not sell your personal data. We only share information with providers that help us run infrastructure, analytics, support, and communications under reasonable confidentiality obligations.
If the app enables camera, sensors, Apple Health, Google Fit, photos, notifications, location, or other device permissions, Bodia requests authorization before accessing them.
We apply reasonable administrative, technical, and organizational safeguards. Even so, no system is completely infallible and we cannot guarantee absolute security.
Depending on your jurisdiction, you may have rights to access, correction, deletion, portability, objection, processing limitation, or consent withdrawal.
Bodia is not intended for minors when the law requires special authorization, and age restrictions may apply by jurisdiction.
When operating in Chile, the United States, Mexico, the European Union, or other territories, we aim to align with applicable privacy and consumer protection frameworks.
We may update this policy to reflect product, security, legal, or App Store and Google Play requirement changes.
Bodia provides digital content focused on fitness, wellness, and training organization. The app does not provide medical services or emergency care.
Any plan, suggestion, routine, scan, or AI-generated content is general informational guidance. Consult a qualified professional before starting or changing physical activity.
You use Bodia at your own risk. Stop any exercise if you feel pain, dizziness, shortness of breath, or any warning sign.
Body metrics, estimates, and scans may be approximate and should not be treated as clinical diagnoses.
You are responsible for using proper equipment, following gym or training-space rules, and complying with applicable local laws.
Bodia may include purchases, subscriptions, promotions, or third-party integrations subject to additional terms and policies.
To the maximum extent permitted by law, Bodia excludes implied warranties and limits liability for indirect, incidental, or consequential damages.
If a jurisdiction does not allow certain exclusions or limitations, they apply only to the maximum extent permitted by local law.
These terms should be reviewed and completed before final launch with definitive legal-entity details and jurisdiction-specific requirements.